Next: n-side
Up: Frequency Response Properties of
Previous: Appendix
Contents
Below are the schematics for the model on the p-side.
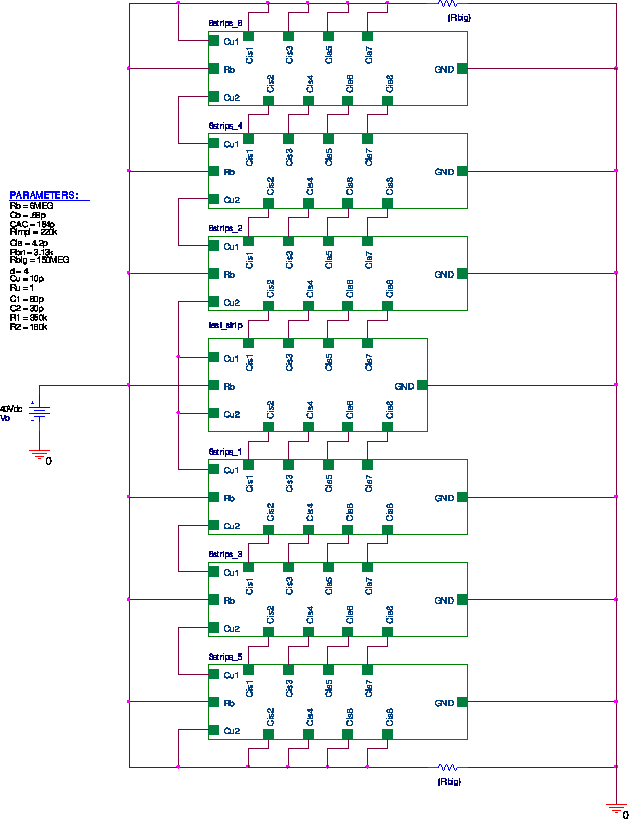
Figure 21:
Top level with values of parameters
|
|
Figure 22:
The test strip and strips around it
|
|
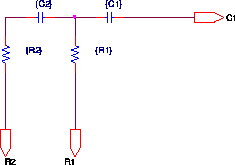
Figure 23:
The test strip
|
|
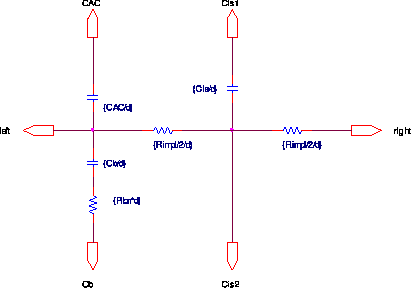
Figure 24:
One division of a strip
|
|
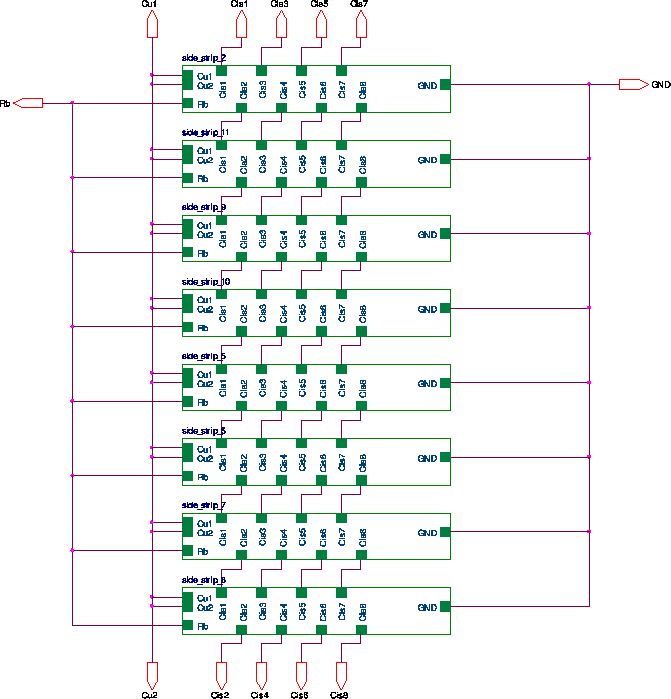
Figure 25:
A block of 8 neighboring strips
|
|
Figure 26:
A neighbor strip
|
|
Figure 27:
Parasitic elements
|
|
![\includegraphics[width=6in]{svt_sch2}](img94.png)
![\includegraphics[width=6in]{svt_sch3}](img95.png)
![\includegraphics[width=6in]{svt_sch6}](img98.png)