

Up: Frequency Response Properties of
Previous: p-side
Contents
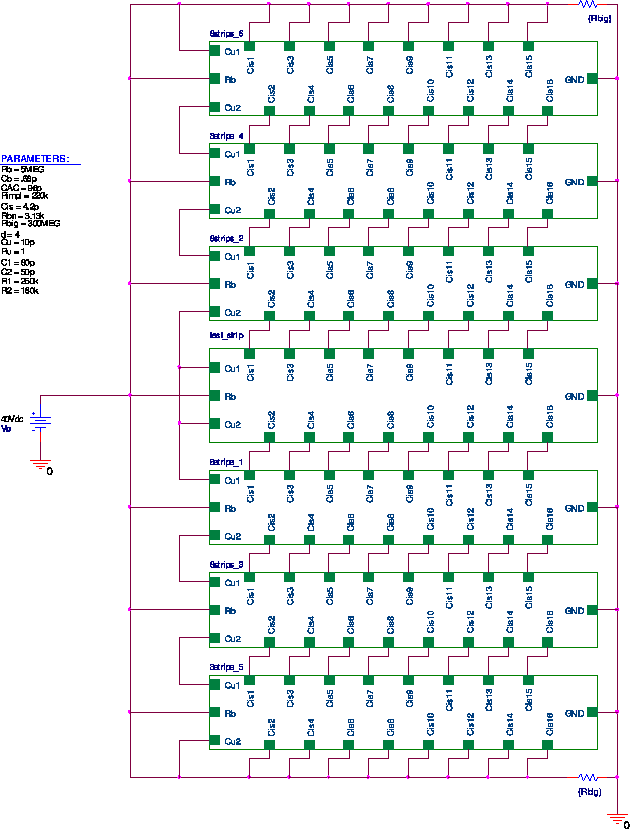
Below are the schematics for the model on the n-side.
Figure 28:
Top level with values of parameters
|
|
Figure 29:
The test strip and strips around it
|
|
Figure 30:
The test strip
|
|
Figure 31:
One division of a strip
|
|
Figure 32:
A block of 8 neighboring strips
|
|
Figure 33:
A neighbor strip
|
|
Figure 34:
Parasitic elements
|
|
