Proposed Algorithm for Setting SVT Chip Thresholds
Proposed Algorithm for Setting SVT Chip Thresholds
Revised: 1/25/99
Introduction:
The threshold for each SVT front-end chip, which has 128 channels,
can be set independently. We would like to set the threshold as
low as possible, while maintaining reasonably low noise occupancy,
in order to achieve maximum efficiency. Three factors play a role
in setting the threshold for a given chip. They are:
- Threshold DAC offset: This is average
threshold DAC offset for all of the channels on the chip.
- Noise: Noisy chips will need higher thresholds
in order to achieve reasonable noise occupancy levels.
- Threshold DAC offset dispersion: This is the
channel-to-channel spread in the threshold DAC offset
for the chip. The channels with the highest offsets
will limit the chip threshold (excluding bad channels).
The original plan was to determine the threshold DAC offset
for each chip by extrapolating the 50% efficiency point to zero
injected charge [1]. We now know that the
chip-to-chip spread in the calibration DAC offset is much more
significant than the spread in the threshold DAC offset in the
original method [2].
Experience with the commissioning module [3]
has shown that, to first
order, one can assume that the threshold DAC offset is zero.
Assuming the threshold DAC offset is zero, one could use a prescription
such as
Threshold = Noise * N1 + Threshold DAC dispersion * N2
where the noise and threshold dispersion are measured from a
threshold scan using charge injection and
N1 and N2 are chosen appropriately (e.g. N1 = N2 = 3).
A complication with
this method is that the measured noise depends on the
amount of charge injected during the threshold scan.
It isn't clear what the noise is for zero injected charge.
Pickup from the command lines, which produces early hits,
can give artificially high values for the threshold
DAC dispersion, which also complicates things.
A final complication is that for a few chips the threshold
DAC offset may not be zero, as we assume.
We propose that the prescription for setting the thresholds
should be to set the threshold such that we get a
well defined noise occupancy. Note that it is likely that
the desired noise occupancy will be different on
different layers ( e.g. the machine background hit rate is
a strong function of layer. One can imagine having a higher
noise hit rate in the inner layers, as long as it remains
small or comparable to the machine background rate.)
The easiest way to find the threshold for a given noise hit
rate would be to scan the threshold with no charge injection
and measure (global) occupancy for a given chip as a function
of threshold. This is straightforward but not robust against unmasked
bad (noisy) channels. Provided that the DAQ can handle the
rate, the desired occupancy should be the occupancy for "good"
channels. A procedure to accomplish this goal is outlined
below.
New Method:
The following is a summary of the steps involved in the new method.
- Do a threshold scan, without the cal_strobe, with Nmax
events per threshold. The trigger jitter window is
set to its maximum value (31 counts) in order to save time.
The noise occupancy can be scaled by the ratio of the
data-taking jitter window and the maximum window offline.
- For each channel, determine the threshold DAC value for which
the occupancy (Nhits/Nmax) is Oave. We will
refer to this threshold value as Thr(Oave,i) for
channel i. This is done by fitting the occupancy
as a function of threshold.
- Make a histogram of the Thr(Oave,i) values for
each chip and fit it to a Gaussian (mean M
and sigma S).
- Choose the threshold that gives an average occupancy of
Oave for the good channels. The good channels are
identified by having Thr(Oave,i) in the range of
M-N*S < Thr(Oave,i) < M+N*S where N
is 3.5 for example.
The following sections describe these steps in more detail.
Step 1: Threshold scan
The only question involved with this step is what value of
Nmax (number of events per threshold) is sufficient to measure the channel
occupancy accurately near an occupancy of Oave.
Here, we are limited by how much time we have to do the threshold
scan. If we have unlimited time, a fit to the occupancy vs
threshold distribution would not be necessary, since we could
measure it accurately enough directly by taking a large number
of events at every threshold.
To determine the threshold for which the occupancy is at the 1 %
level or less, a fit is probably required. The plots below show two
threshold scans for a particular channel where the data were taken
with no cal-strobe command. The plots on the left (right)
are for 100 (10,000) events per threshold.
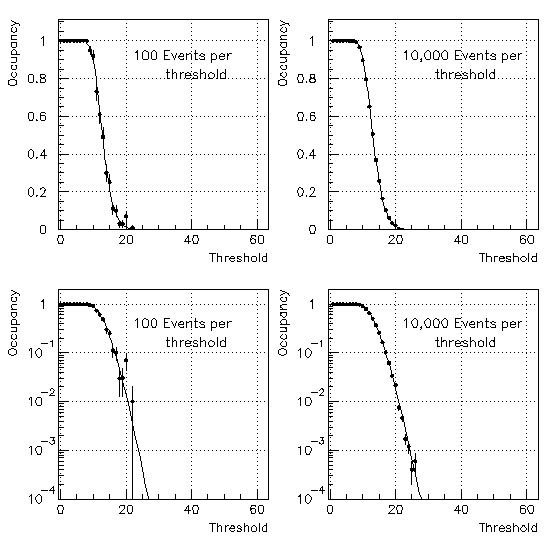
The occupancy as a function of threshold
is fit to the functional form
[4]

where

and
-
 is the occupancy at threshold t.
-
 is the frequency of noise hits
at threshold t.
-
 is the frequency of noise hits
at zero threshold.
-
 is the jitter time.
-
 is the noise (free to float in the fit).
-
 is the threshold offset
(free to float in the fit).
The interpretation of the parameters in the fit as they are labled
above may not be valid, but what matters is that the function
can be used to fit the data well.
The fit can done using the Newton-Raphson method
[5] in a closed form. By "closed"
we mean there are no unlimited iterations or dependencies on
other software packages, such as MINUIT.
Step 3: Fitting the histogram of Thr(Oave,i) values
The top plot below shows the histogram of threshold values
(Thr(Oave,i)) for which
the occupancy is 1.0% for a given chip. The lower plot shows
Thr(Oave,i) as a function of channel number for this chip.
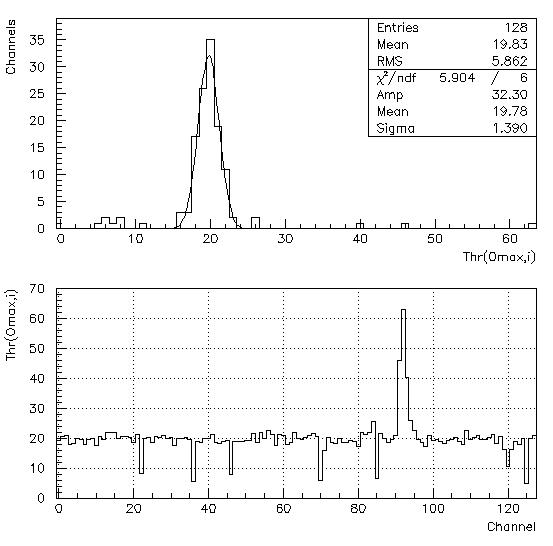
There are a few unbonded channels which have Thr(Oave,i) values
at or below 10 dac counts. There is also a group of noisy channels
near channel number 93. Fitting the top histogram is an effective
way to determine the average behavior of the good channels without
being influenced by bad (noisy and unbonded) channels.
Step 4: Choosing the threshold for data taking
In order to get a sensible threshod, it is essential to identify
bad channels (noisy or unbonded) and remove them from the
calculation of the occupancy for the chip.
For example, if one channel is stuck on and it is not removed
from the average occupancy for the chip, the average occupancy
will be at least 1/128 = 0.78% no matter what threshold you choose.
We propose only using channels which have
M-N*S < Thr(Oave,i) < M+N*S,
where N is 3.5 for example, for calculating the occupancy of the chip.
This effectively removes unbonded and noisy channels from the calculation
of the occupancy. The occupancy for each good channel is given by the
fit described in Step 2. The set threshold is the
one that gives an average occupancy of Oave for the good channels.
The algorithm applied to layers 1 and 2 after installation
We have applied the algorithm described above to data taken with
layers 1 and 2 after installation on the cones. The data are from
run 20206 which used a shaping time of 100 ns. The jitter window
was set to it's maximum value (31) and the scan was done without
sending the cal_strobe command. All of the plots below will show
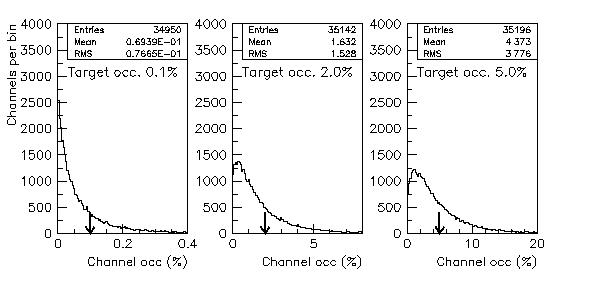
results for three target occupancies: 0.1%, 2.0%, and 5.0%.
The histograms below show the spectrum of set thresholds
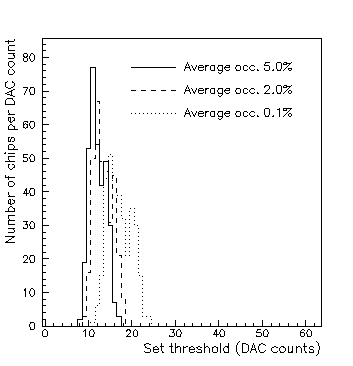
The three plots below show the chip average occupancy for the three
different target occupancies. The solid histogram uses only the
good channels ( M-N*S < Thr(Oave,i) < M+N*S, ) for the calculation.
The dashed histogram uses all nominally used channels.
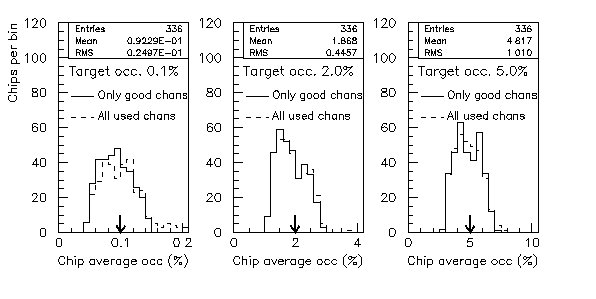
Note that while a few bad chanels may not strongly affect the average occupancy
once the threshold is selected, they can make selecting the
threshold very difficult. Also note that the width of the distribution
of chip occupancies scales with the target occupancy. This is because
the slope of the occupancy vs threshold curve increases with occupancy,
so a one count difference is a larger difference in occupancy for larger
occupancies.
The plots below show the spectrum of channel occupancies.
References:
1) SVT Gains and Offsets from
UCSB TestBench.
(go back to text)
2) Study of AToM chip
offsets.
(go back to text)
3) Carsten's
commissioning module page.
(go back to text)
4) Amedeo Perazzo's derivation of the noise hit
rate as a function of threshold.
(go back to text)
5) Louis Lyons, Statistics for nuclear and particle physics,
Cambridge University Press (1986) p. 134-137.
(go back to text)
Revised: 1/25/99
owen@electron.physics.ucsb.edu
claudio@muon.physics.ucsb.edu


 is the occupancy at threshold t.
 is the frequency of noise hits
at threshold t.
 is the frequency of noise hits
at zero threshold.
 is the jitter time.
 is the noise (free to float in the fit).
 is the threshold offset
(free to float in the fit).


