![]()
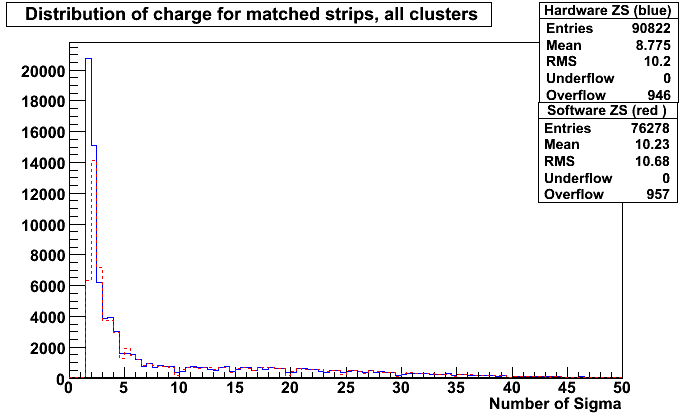
The source code for the above can be found here This the distribution of the Signal to Noise of both Feds.
!
The source code for the above plot can be found here
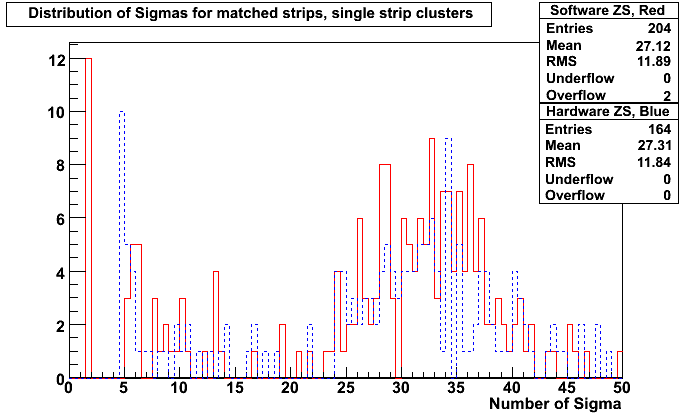
The above plot is the distribution of the S/N for all single strip clusters.
What is noteworthy is that there are 3 events where the S/N < 5. I am not sure
as to why this is.
The source code for the above plot can be found here
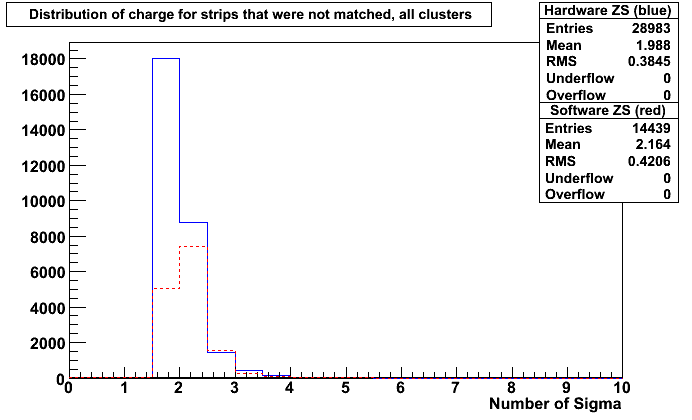
The above plot is the S/N distribution for strips that were passed by one FED's
but not by the other. From this plot, one can see that this happens often, but only
for strips with low S/N.
A possible explanation is that the optical splitter is not
perfect.
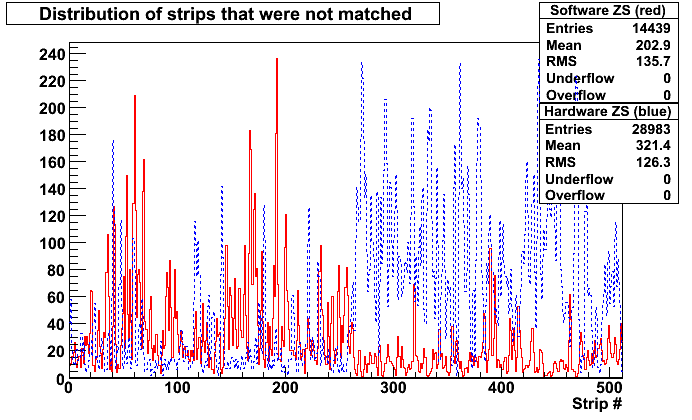
The source code for the above plot can be found here This is a histogram of the strips that were passed by one Fed but not the other.
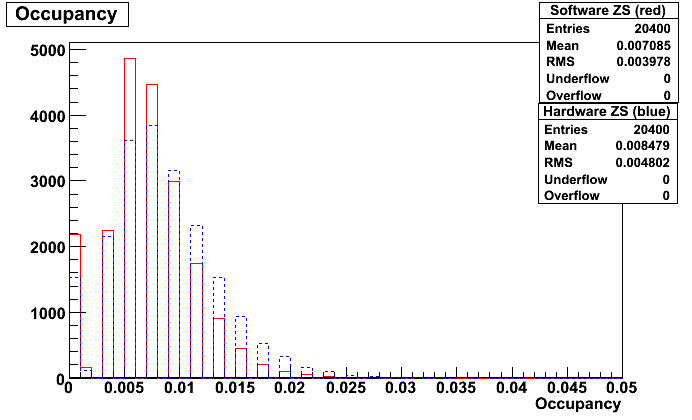
The source code for the above plot can be found here
Occupancies of the 2 Feds.
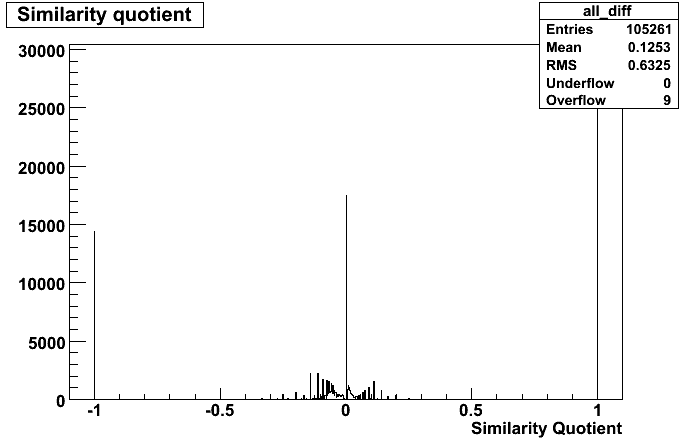
The above plot of what I call the Similarity Quotient, which is defined as the ratio of the difference of the signals of the two FEDS to the sum of the signals (Hardware Zero Suppressed Fed's signal - Software ZeroSuppressed Signal) divided by the Sum. So if the signal is passed in Hardware but not in Software, the similarity quotient would be 1 and if passed in Software but not in Hardware, it would be -1. The source code for the above plot can be found here